Categories
Overview
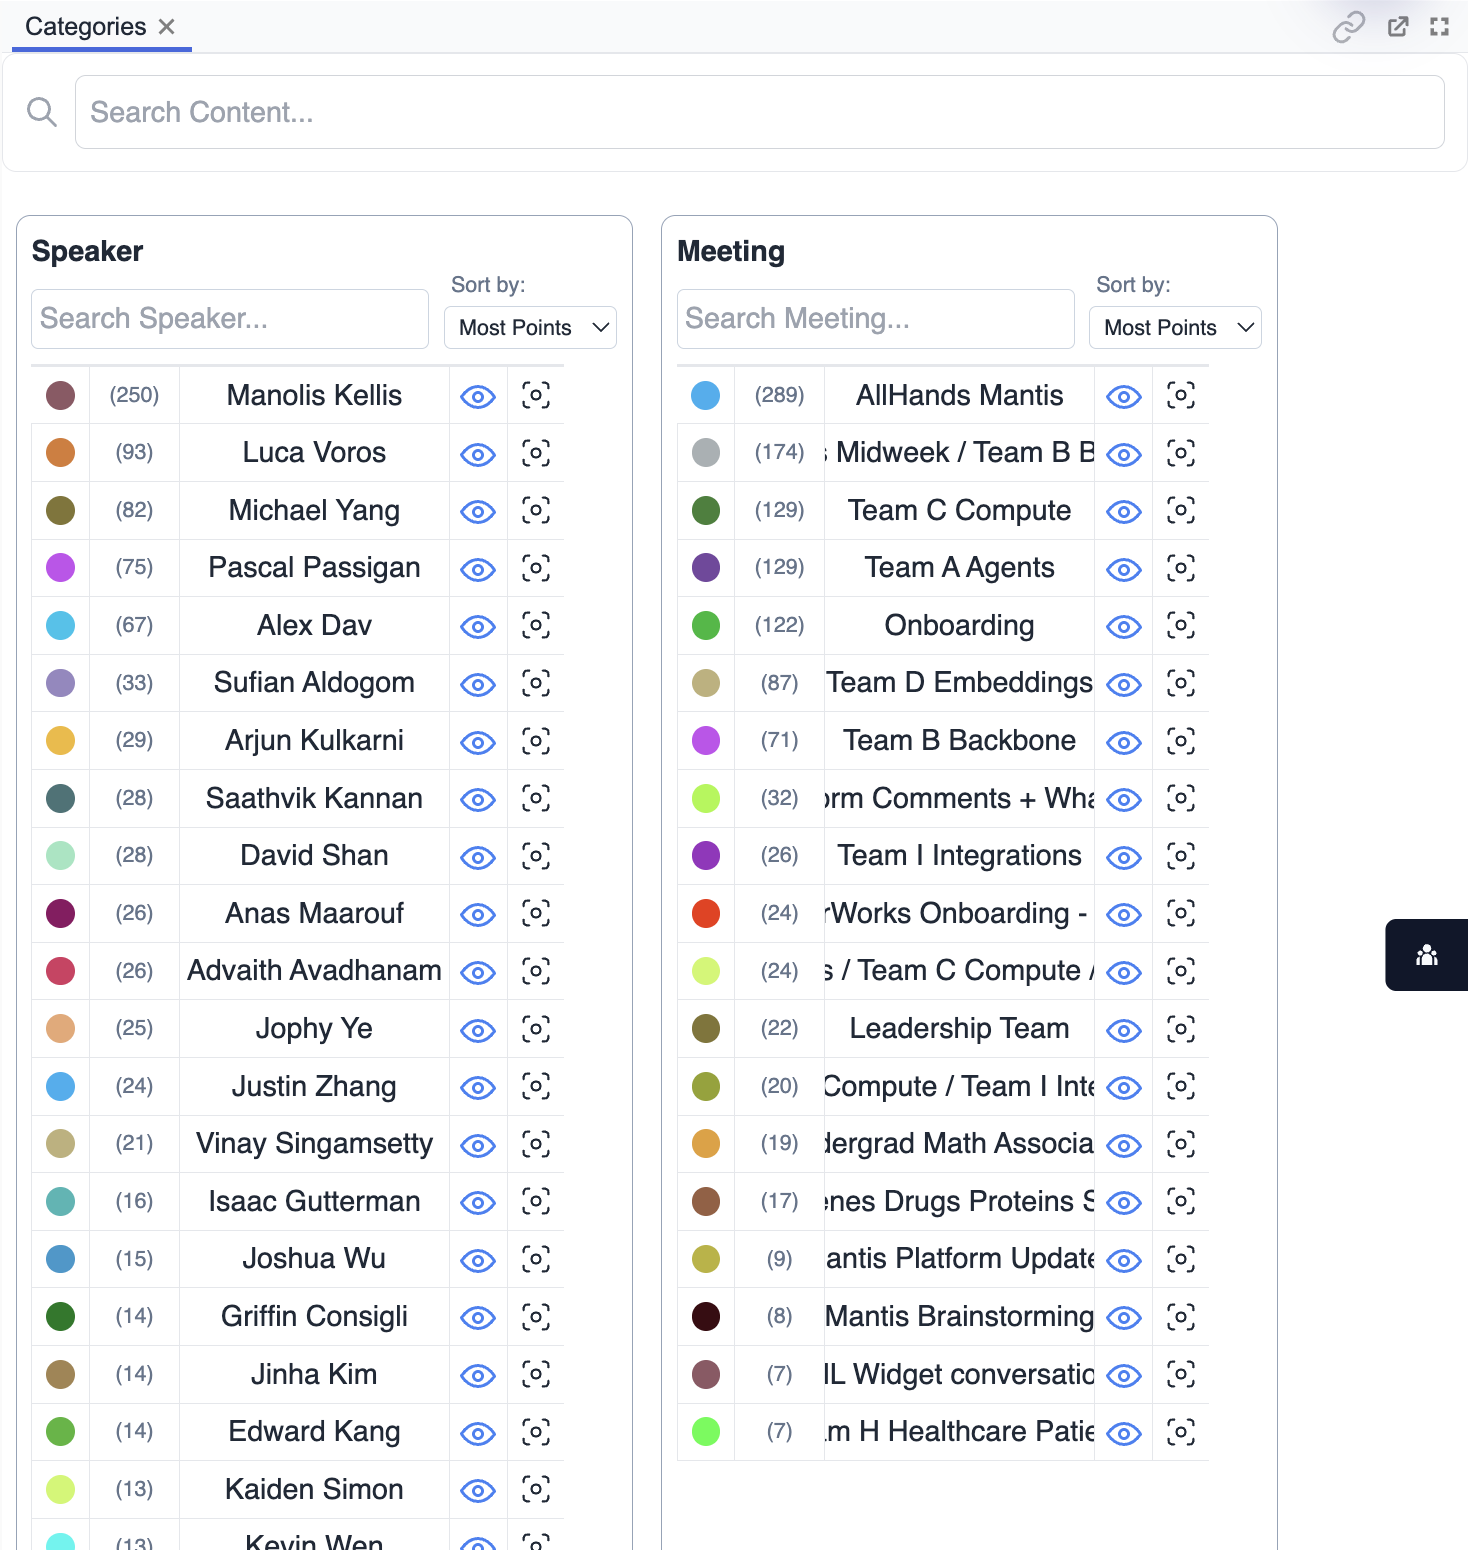
The Categories panel displays key groupings or labels assigned to data points in your space. It offers a simple way to filter, highlight, or compare data based on categorical attributes such as type, status, or manually assigned tags.
Purpose
- Quickly filter and view data points by their assigned category.
- Compare distributions and relationships between different categories.
- Highlight, select, or bag items within a specific category.
- Simplify exploration by focusing on meaningful data groupings.
Key Features
- Category List: Displays all available categories and their item counts.
- Filter by Category: Instantly show or hide points belonging to a selected category.
- Highlighting: Highlight or color points on the map based on category.
- Quick Selection: Select or bag all points in a chosen category with one action.
- Dynamic Updates: Category assignments and counts update as you interact with data.
Tips
- Use categories to break down complex data into manageable segments.
- Compare how different categories are distributed across your space.
- Combine category filtering with map or plot views for deeper insights.