Point Analysis View
Overview
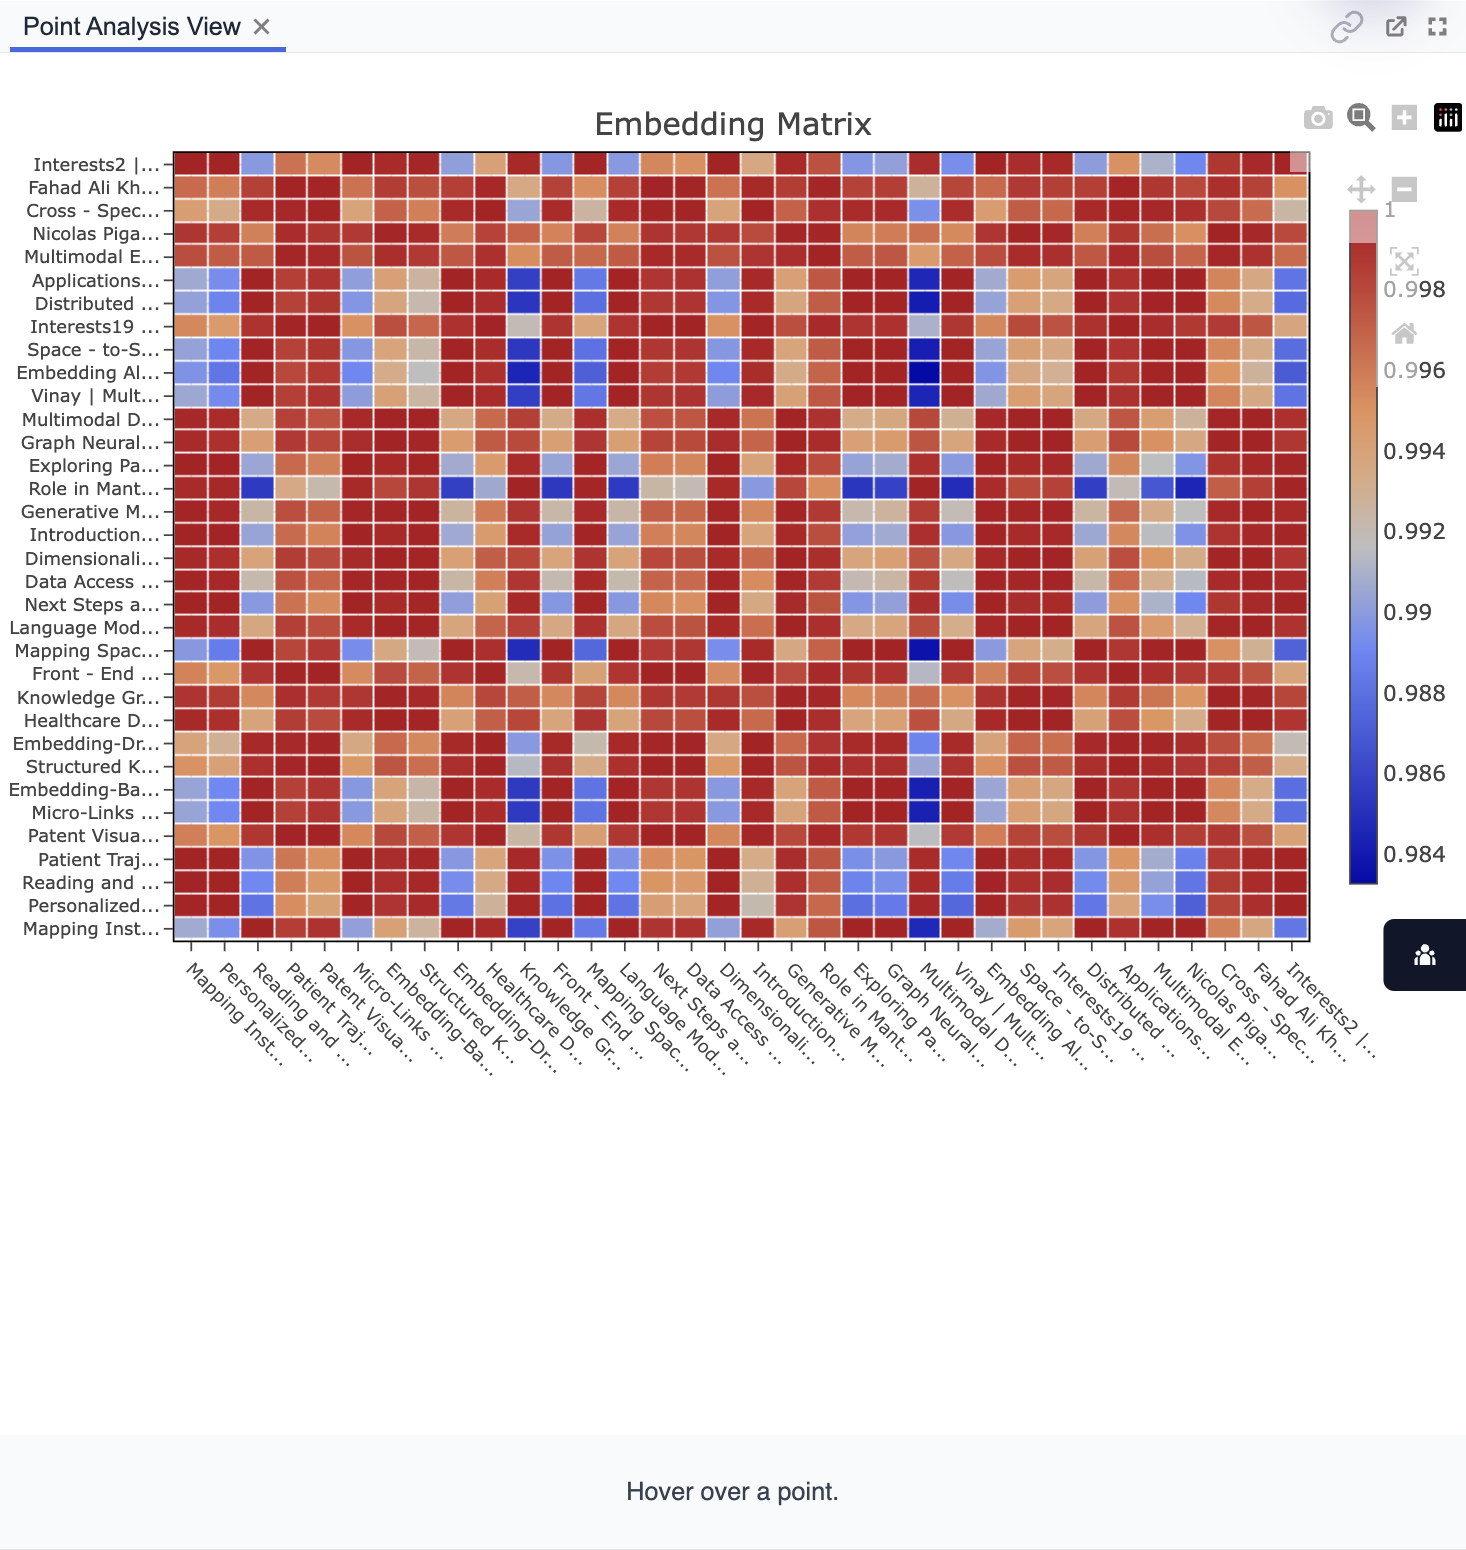
Point Analysis View displays the results of your configured analysis as a matrix visualization. Typically, this is an embedding similarity matrix, showing pairwise relationships between selected items.
Purpose
- Visually explore similarity or relationship patterns between selected points/items.
- Identify clusters, outliers, or close associations in the embedding space.
- Interact with the heatmap to inspect similarity scores.
Key Features
- Embedding Matrix Visualization: Grid view with color-coded similarity values.
- Row/Column Labels: Each axis shows the selected items from controls.
- Color Scale: Indicates the degree of similarity (e.g., from blue to red).
- Hover Details: See precise values or item names by hovering over cells.
Tips:
- Hover over matrix cells for detailed similarity information.
- Use the matrix to spot patterns, such as groups of highly similar notes.
- Adjust selections in the controls to update the matrix view instantly.