Map
Overview
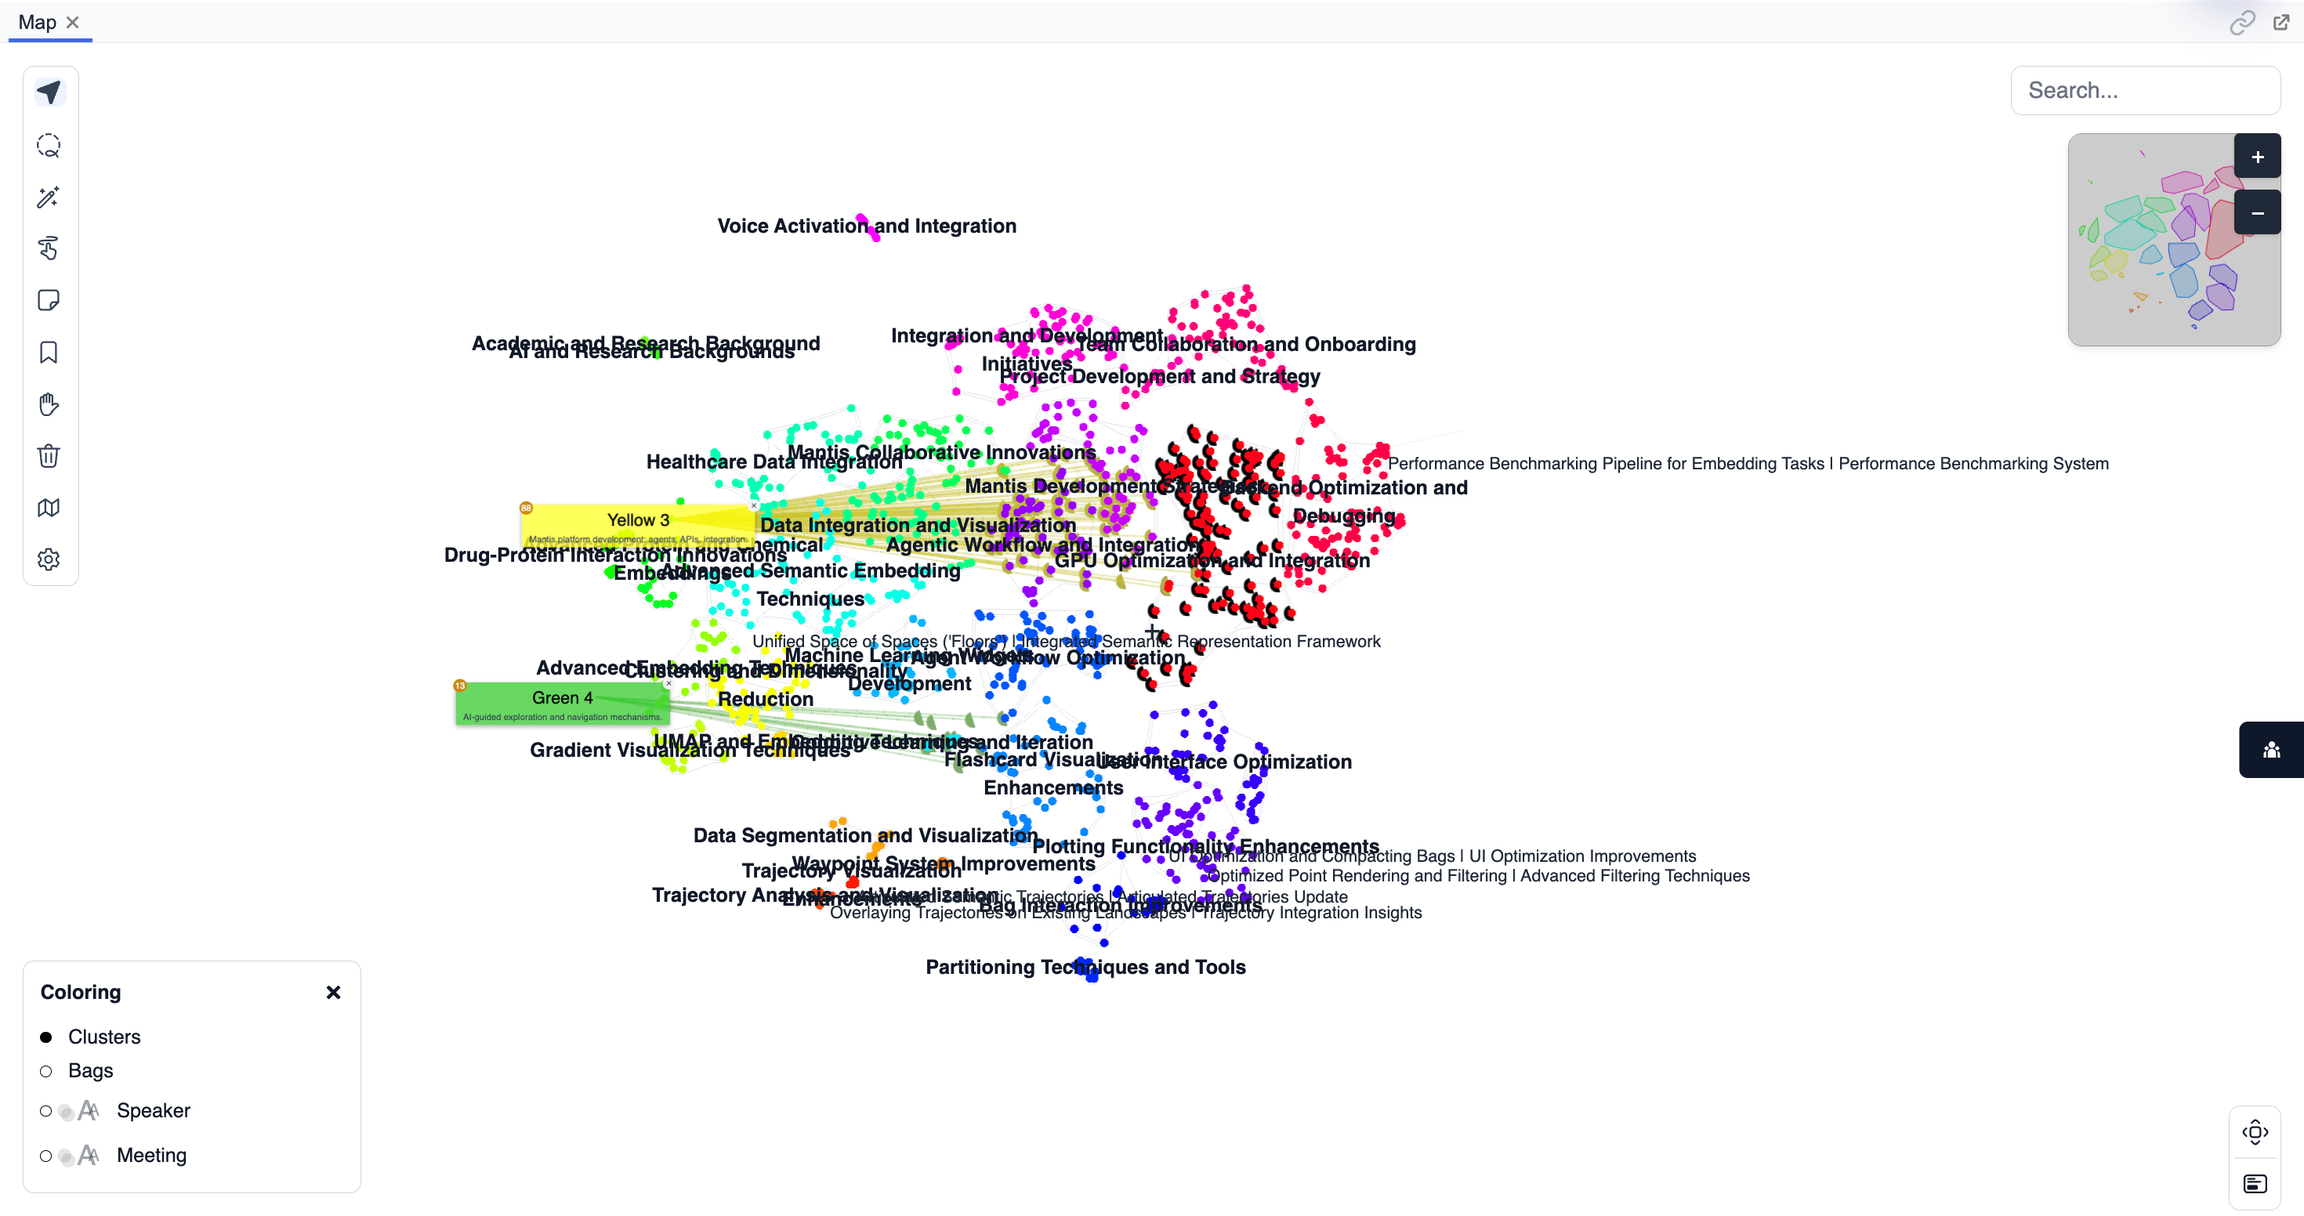
The Map panel is the main visualization space in Mantis, displaying points, bags, and clusters as a spatial embedding. It provides an interactive, high-level view of your data landscape, letting you navigate, select, and explore conceptual relationships between items.
Purpose
- Visually explore the overall structure and relationships within your dataset.
- Identify clusters, patterns, or outliers through spatial proximity.
- Select and highlight points, bags, or groups for further analysis.
- Navigate large data spaces efficiently with panning and zooming.
Key Features
- Interactive Embedding: Points are displayed according to their semantic or feature-based similarity.
- Selection Tools: Click, lasso, or rectangle-select points directly on the map.
- Bags and Clusters: Visualize and differentiate groups with color-coding and labels.
- Real-Time Updates: The map updates instantly with changes in filters, selections, or analysis parameters.
- Zoom and Pan: Move across the data landscape for focused or global views.
- Hover Details: Hover over points to see key metadata or feature values.
Tips
- Use lasso or box select to quickly group and bag points of interest.
- Zoom in to inspect dense areas or outliers in detail.
- Click on points or clusters to highlight and synchronize with other panels.